K-Means Clustering
Mathematics for AI and Machine Learning
From the book
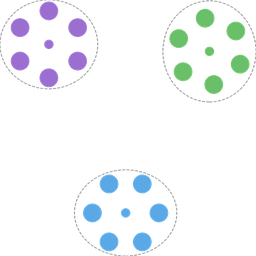
This pictogram belongs to the Mathicon figure library for Kmeans Clustering. It follows the same visual conventions as the book diagrams even when it is not tied to a single printed mind-map node.
What this drawing shows
What you see. Colored data points appear cluster by cluster, then centroids migrate from the center and dashed boundaries form.
In the book. Look up K-Means Clustering in the manuscript index or chapter mind maps.
Where to read next
Look up K-Means Clustering in the book index to find the matching figure or discussion. The pictogram follows the same visual conventions as the printed diagrams.