Saddle Point
From the book
Chapter 12: Optimization Methods. In the chapter mind map this icon labels Minimax Optim: Saddle Points. The discussion below is excerpted and lightly edited from § Theorem: Necessary Conditions for Optimality in Mathematics for AI and Machine Learning.
the book figure illustrates a saddle point for the function $f(x,y) = x^2 - y^2$ at $(0,0)$. The 3D surface plot shows that while $\nabla f(0,0) = 0$ (the gradient is zero), the Hessian $\nabla^2 f$ is indefinite (not positive semidefinite). The blue curve along $y=0$ shows the convex direction (minimum along the $x$-axis), while the red curve along $x=0$ shows the concave direction (maximum along the $y$-axis). The gray transparent plane at $z=0$ represents the zero gradient level. This visualization makes concrete why the Hessian condition $\nabla^2 f(x^*) \succeq 0$ is necessary for optimality: a point with zero gradient can be a saddle point (not a minimum) if the Hessian has both positive and negative eigenvalues. In deep learning, saddle points are common in high-dimensional optimization landscapes, and second-order methods or techniques like momentum are used to escape them.
What this drawing shows
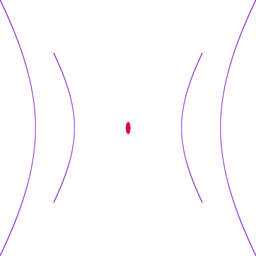
What you see. Depicts a point that curves upward in one direction and downward in another, common in min-max optimization and nonconvex loss surfaces.
In the mind map. Chapter 12 — Minimax Optim: Saddle Points. See From the book above for definitions, figures, and worked examples.
Where to read next
Read the full definitions, figures, and worked examples in Chapter 12: Optimization Methods — see the mind-map node Minimax Optim: Saddle Points.